Compare reports across conditions at a glance
- You don’t have to build several reports, changing the target user for each segment or platform.
- One split table lets you compare results over the same period and on the same basis.
Split by breaks a single metric down by a chosen criterion.
You can split by segments, or by user and device properties and tags. Within each event, the table rows are split by value, so you can compare the differences across values in a single report.
Examples:
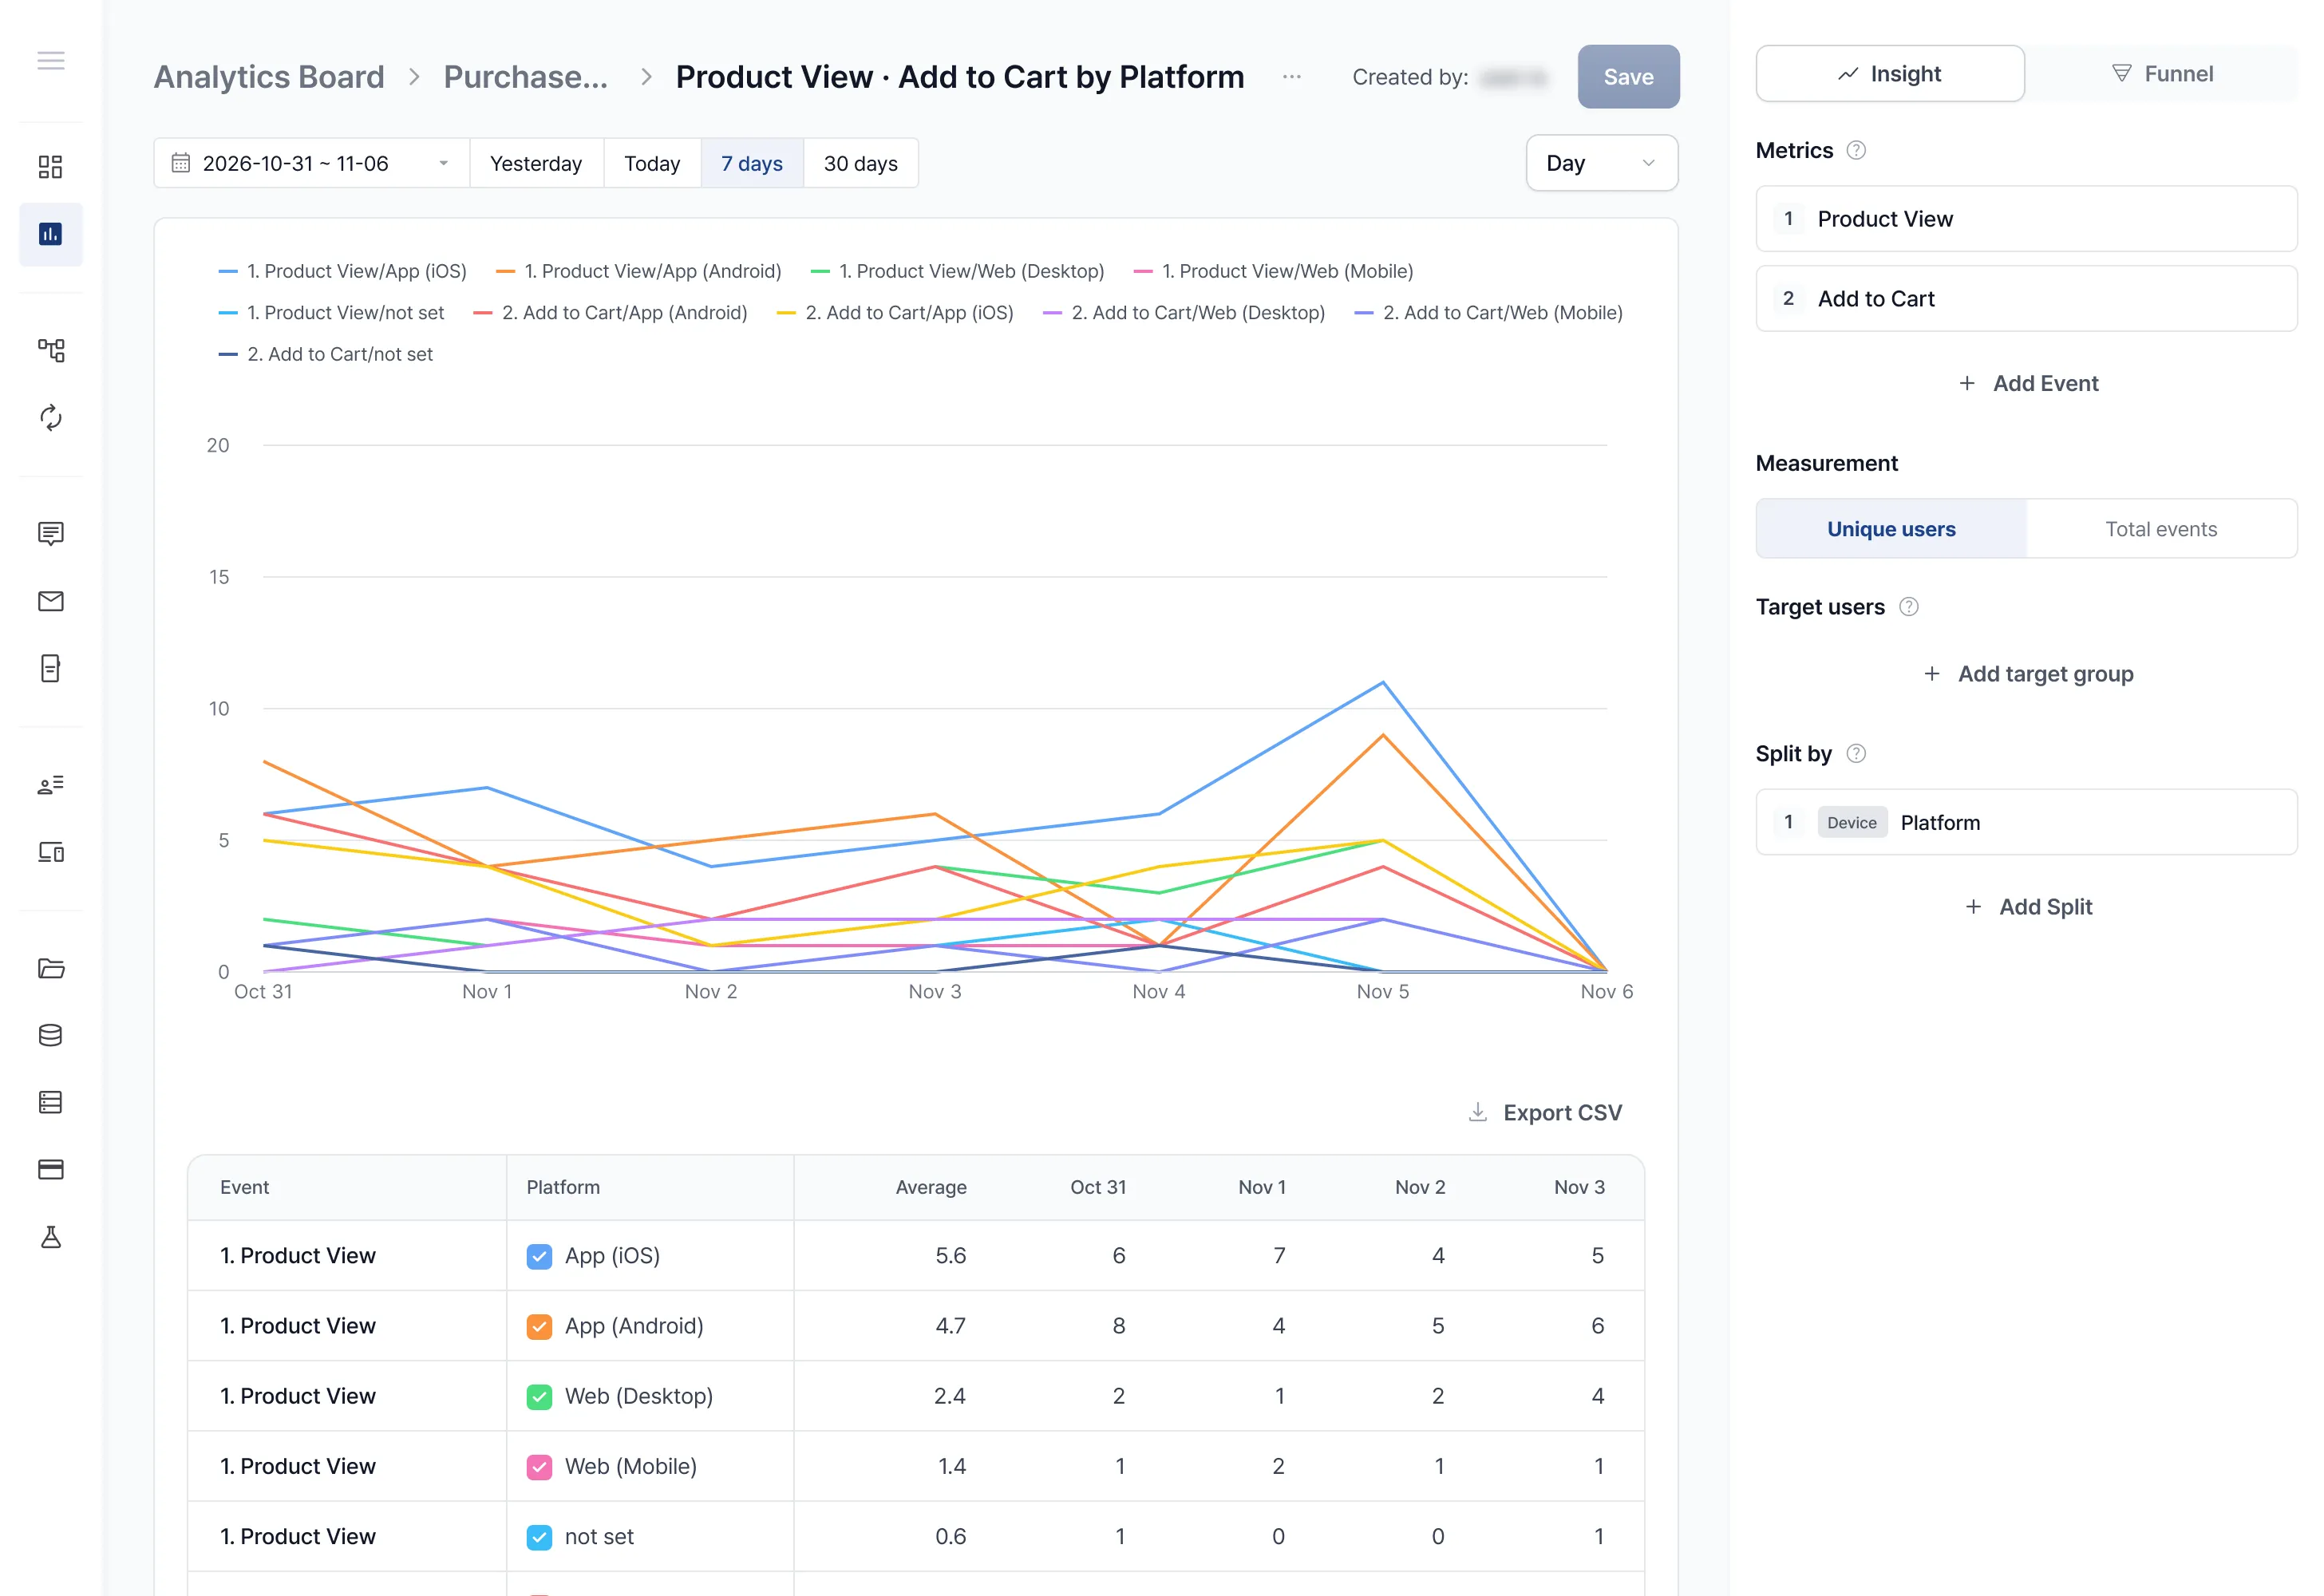
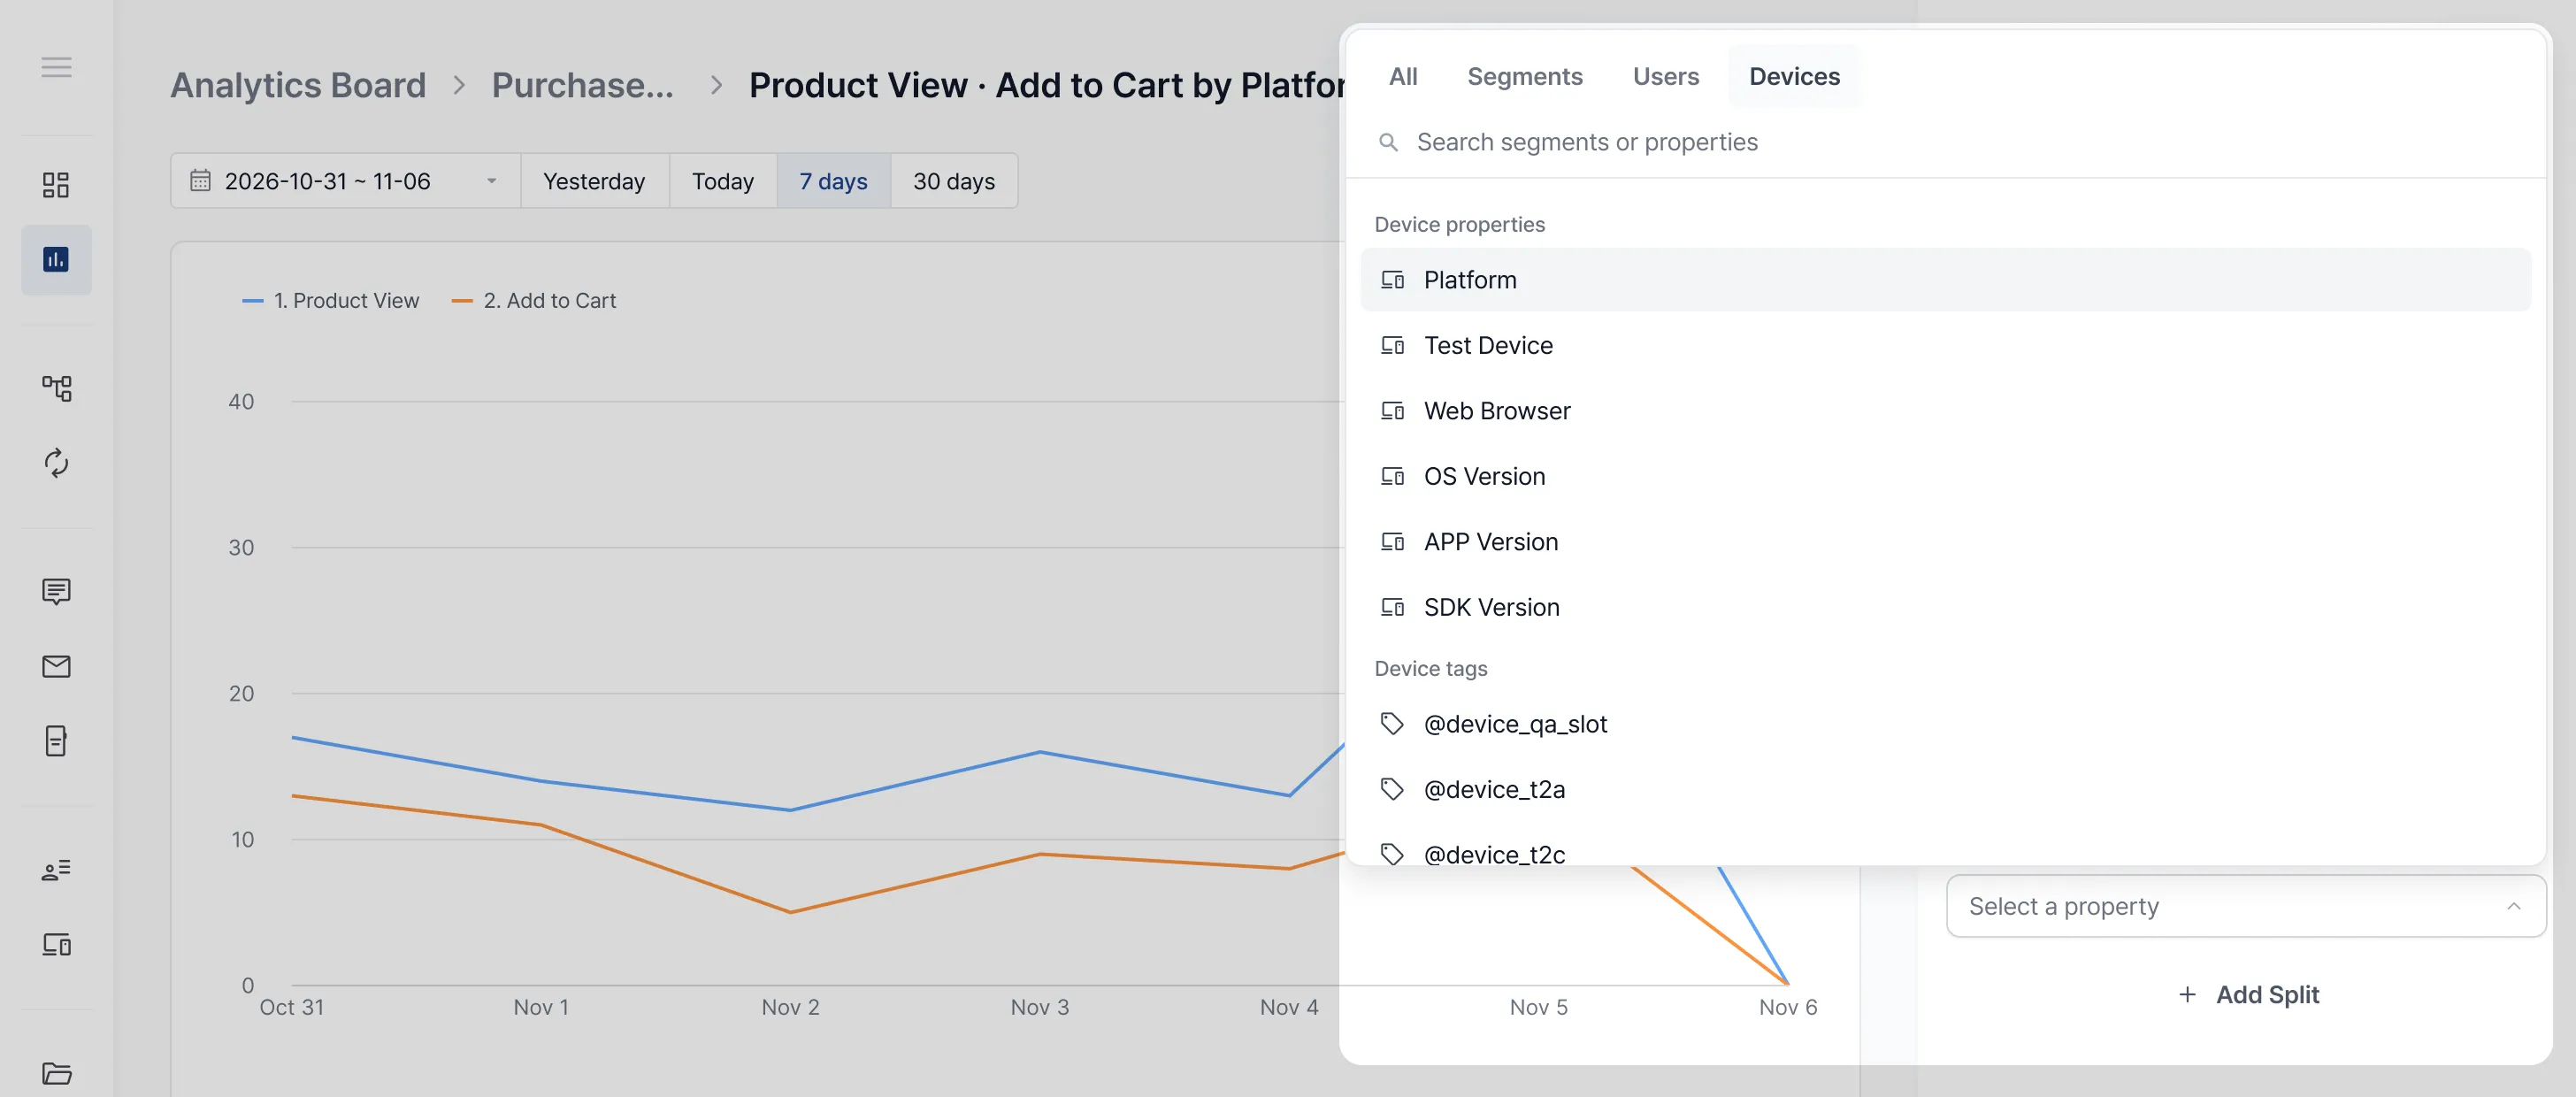
In the report editor, click Add split in the Split by area.
In the picker, choose the criterion to split by. You can split by segment, user, or device.
The chart and table are redrawn automatically. In the table, each event’s rows are split by value, and the chart draws one line per row.
Check or uncheck specific metrics in the table to choose what the chart shows.
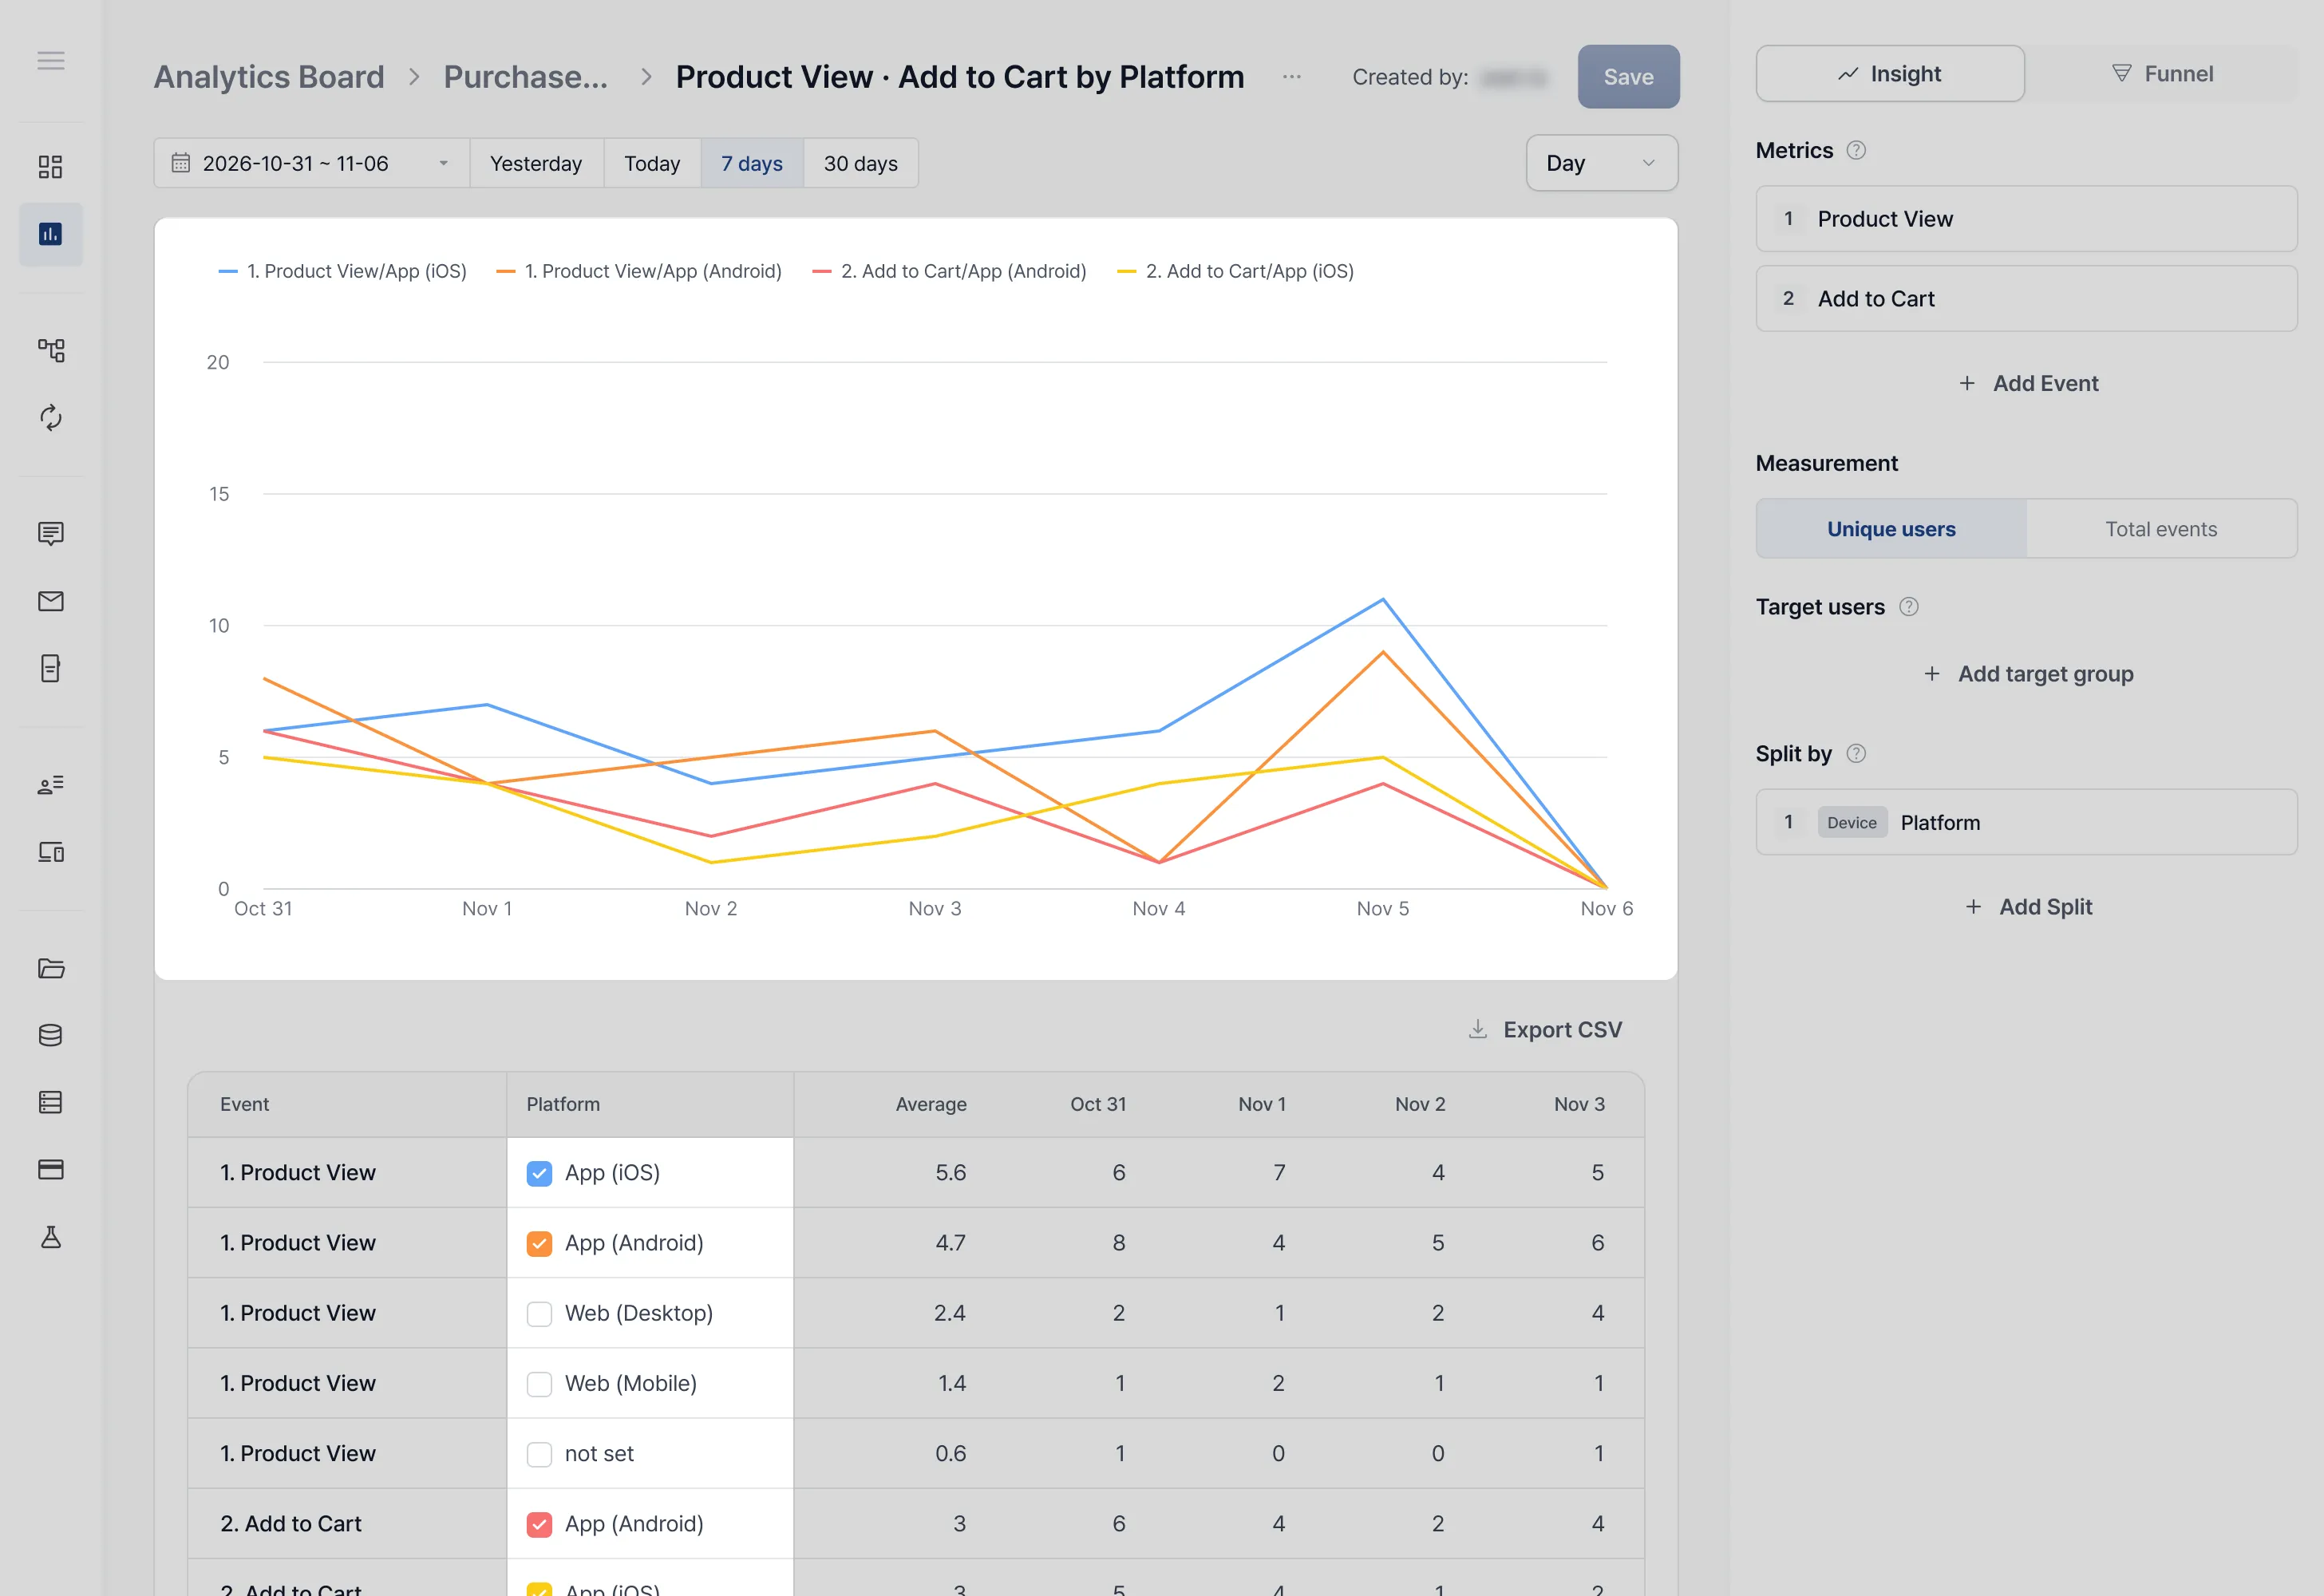
Compare reports across conditions at a glance
Compare users in and out of a segment
Narrow down why users drop off in a funnel