Funnel Tips
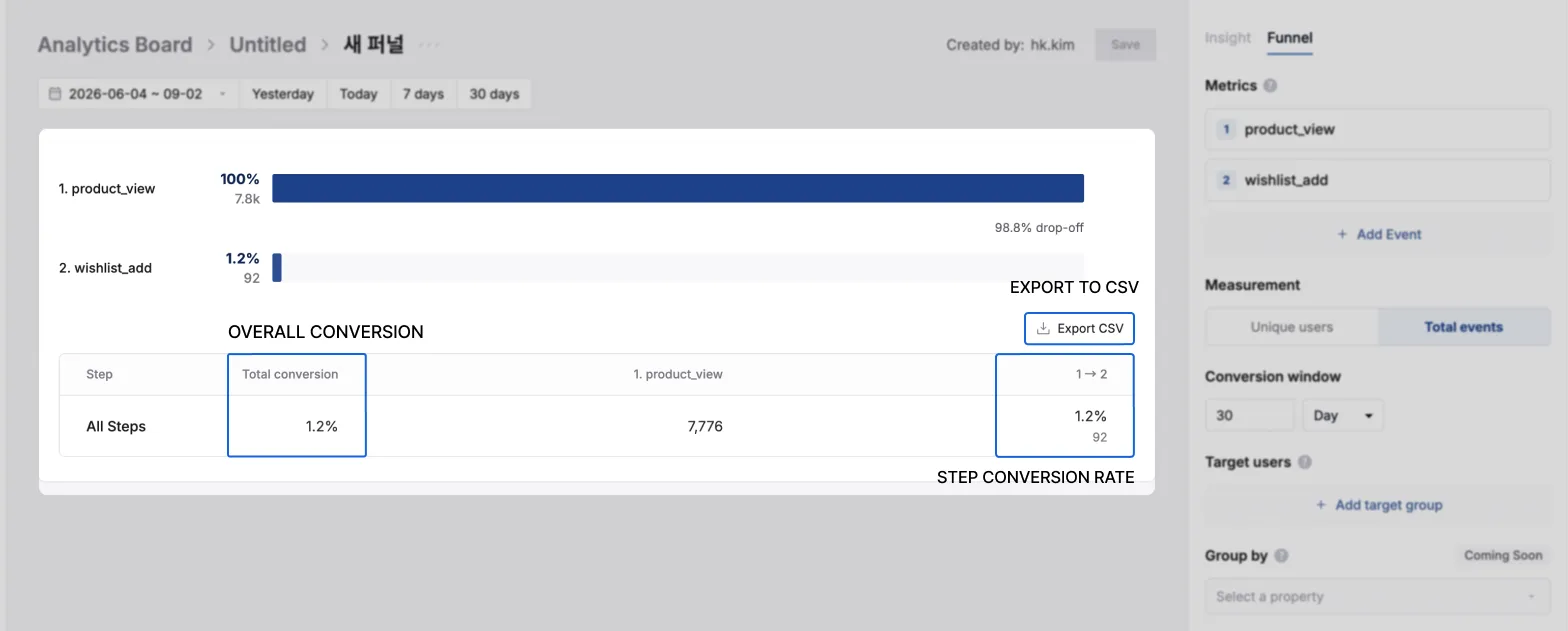
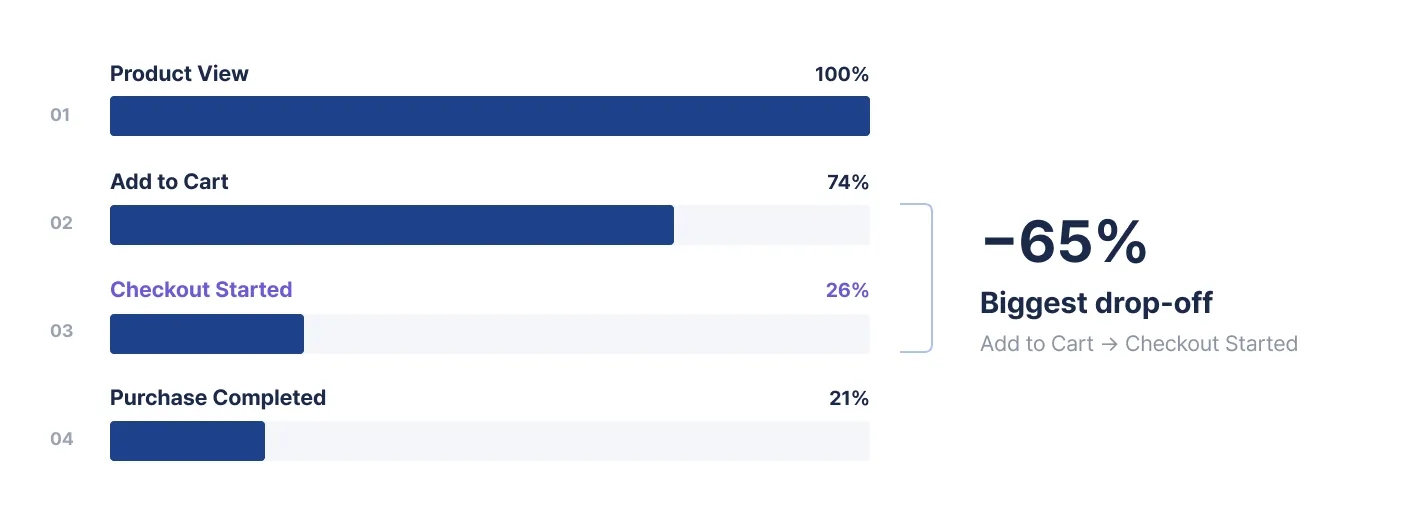
A Funnel shows how many people pass through several steps in order as a bar graph. Use it to find “where do people drop off most”.
- Product view → add to cart → start checkout → complete checkout
- Sign-up → email verification → first login
- Notification received → app open → target action
Creating a Funnel
Section titled “Creating a Funnel”- Select Create > Funnel.
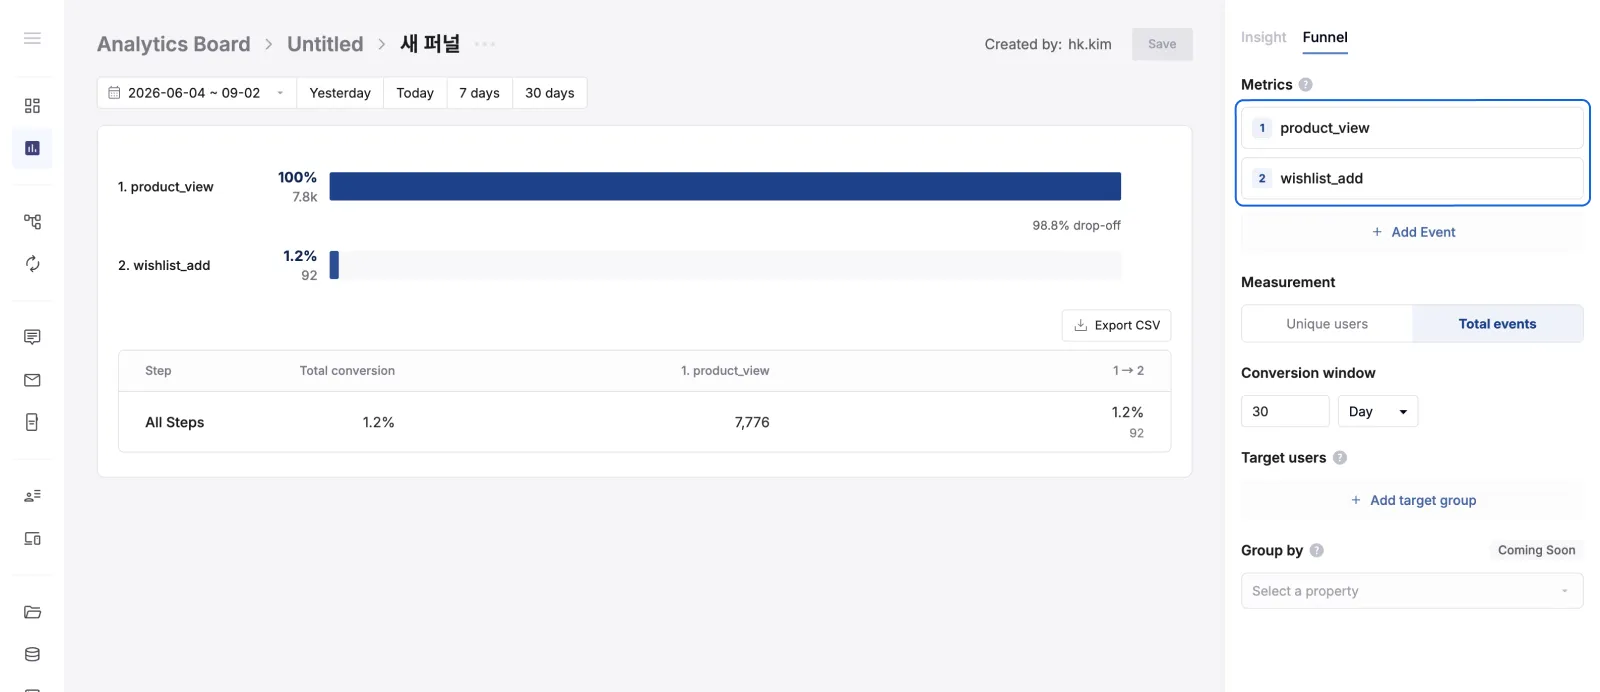
- In Metric, add events in order. The order you add them becomes the funnel steps (step 1, step 2, and so on).
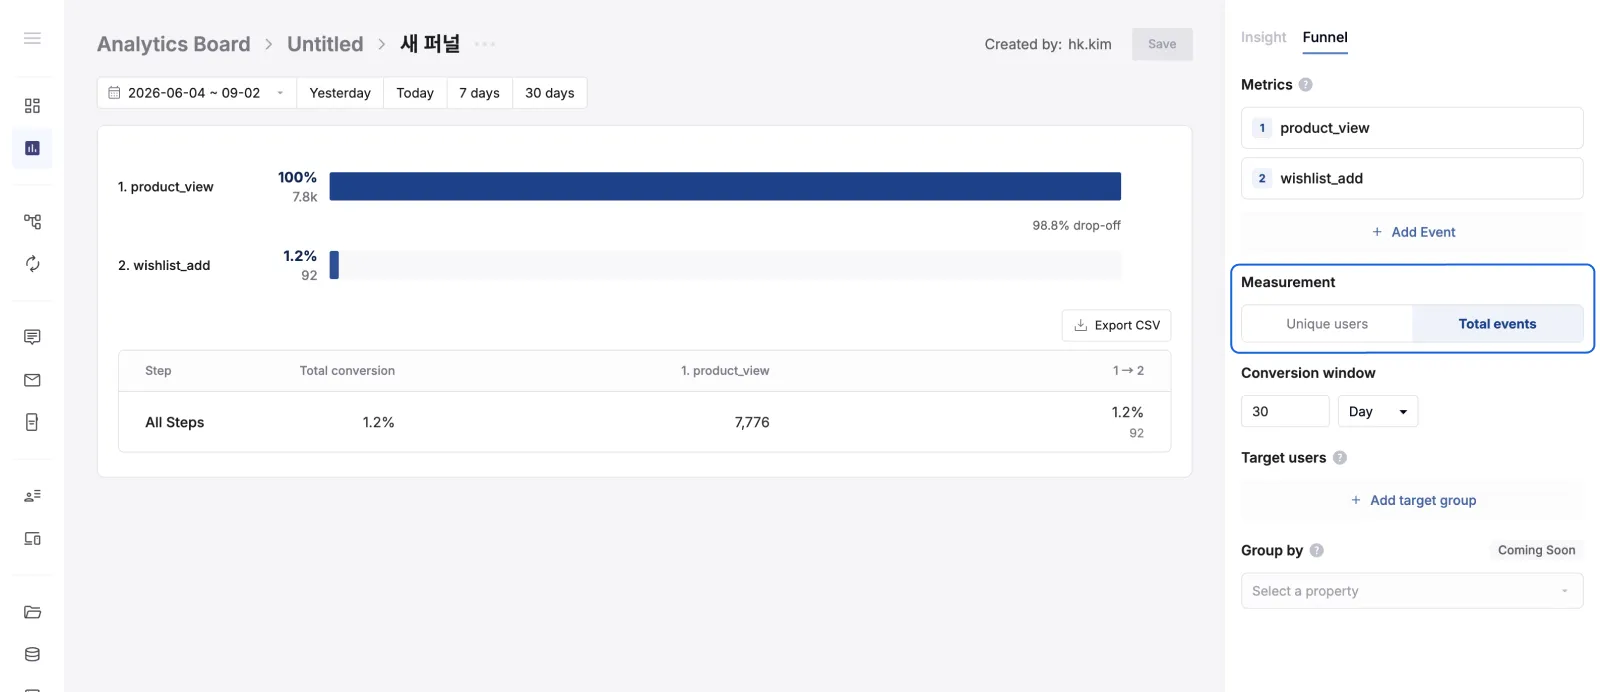
- Choose the Measurement. Starting with
Unique Useris usually recommended.
- Select the date range to query at the top.
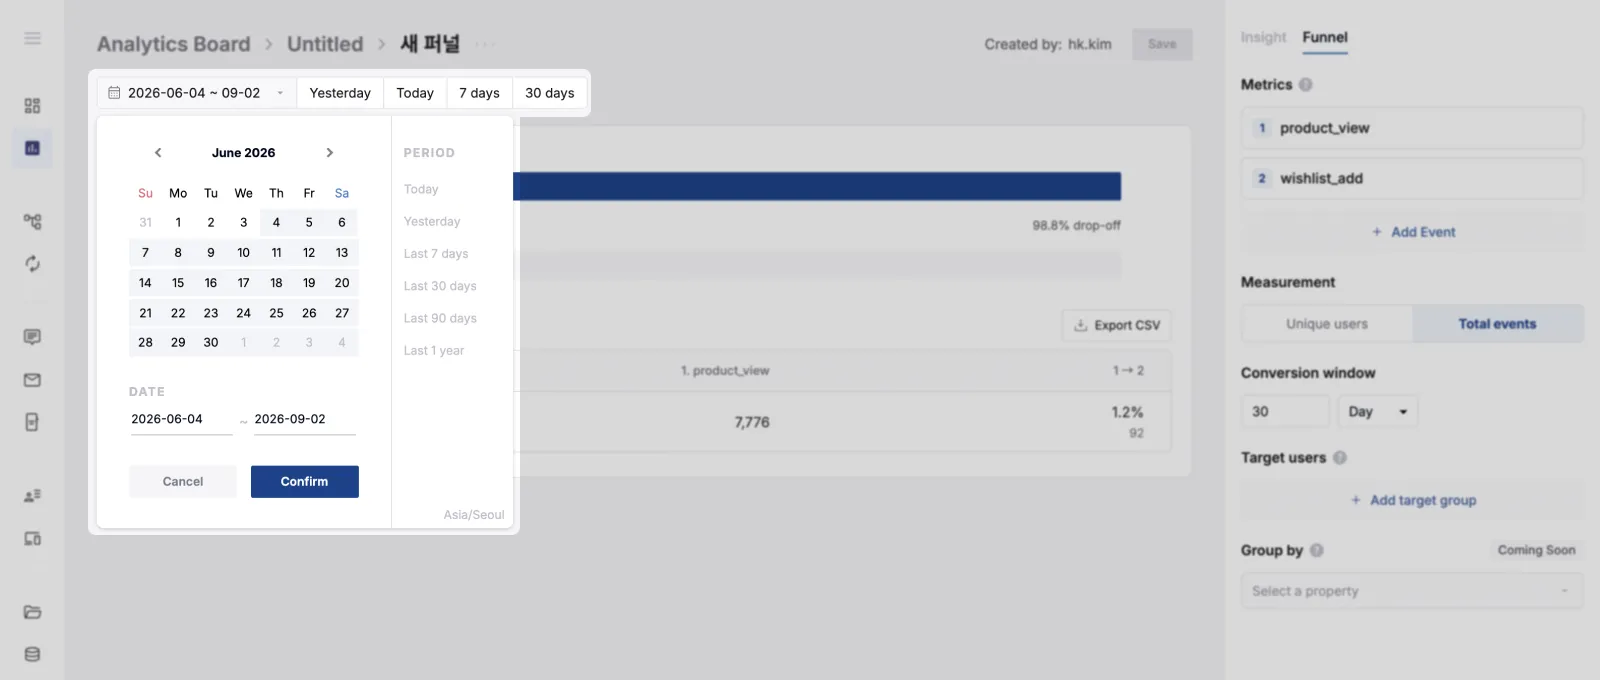
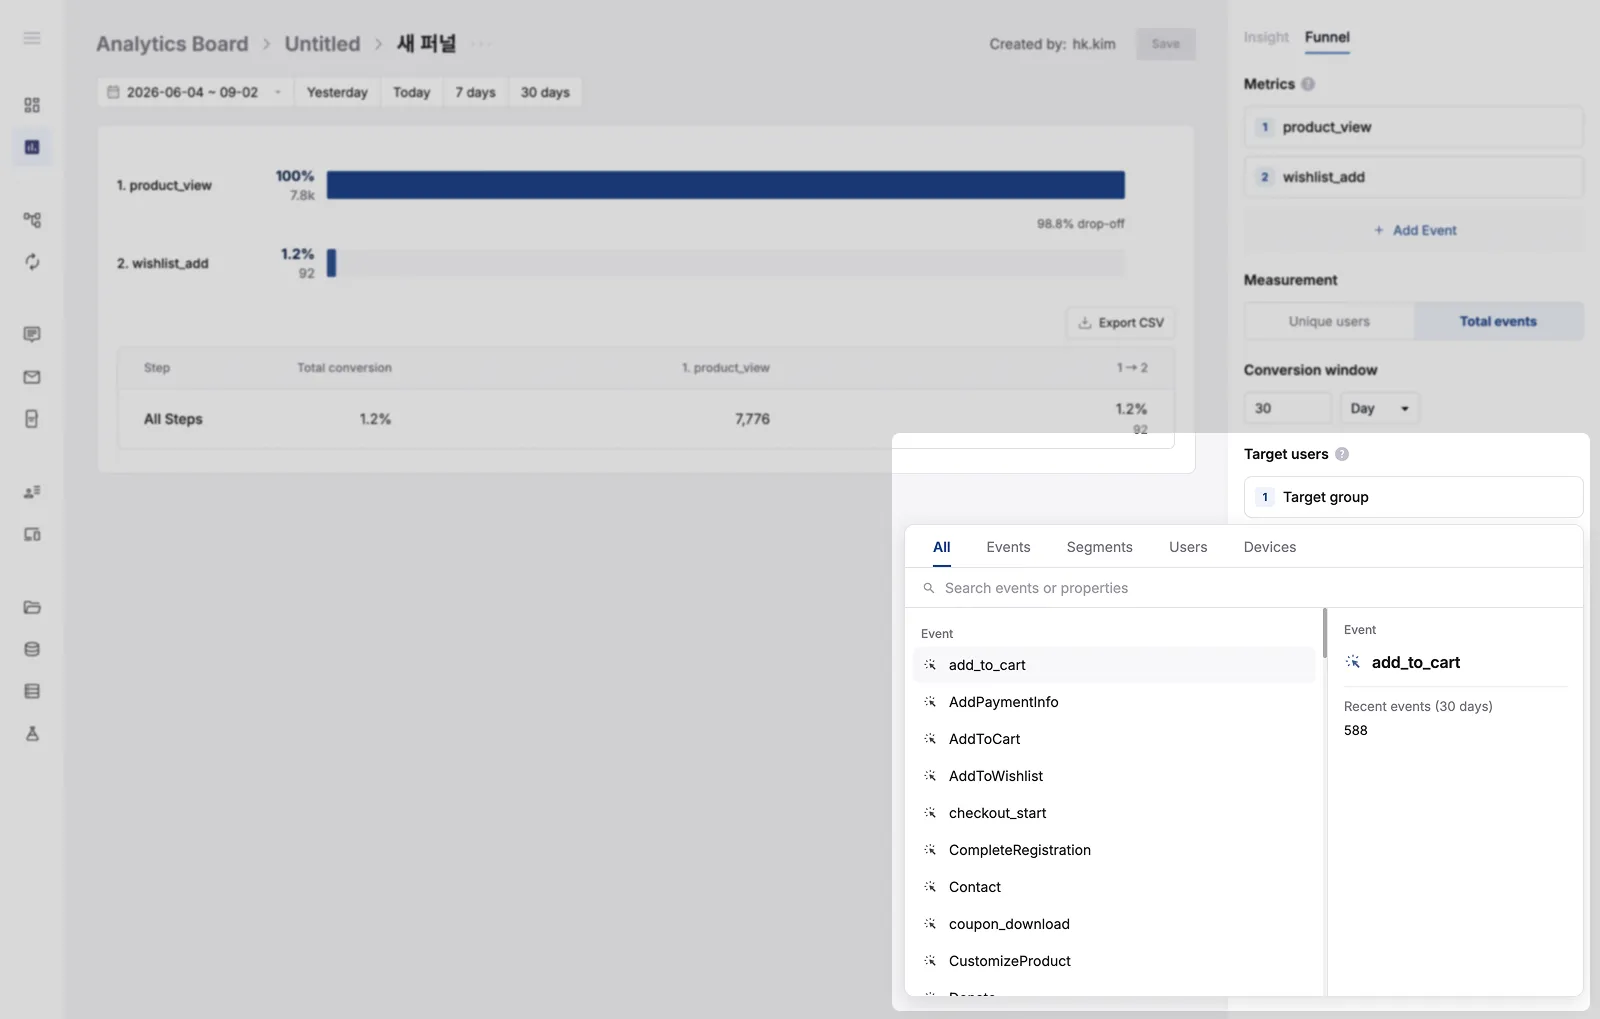
- Use Target User to set who the metric is measured for. If you leave it empty, all users are included.
- Click “Save” to save your changes.
Reading the graph and table
Section titled “Reading the graph and table”| Item | Description |
|---|---|
| Step value | The number of users (or event count) who completed the steps in order up to that point. The unit depends on the Measurement set in the right panel.• With Unique User: how many people converted or dropped off.• With Total Count: how many times the event converted. |
| Conversion by step | The share of those who completed the previous step and reached the current one. Conversion from event 1 to 2 is always calculated with the metric that passed step 1 as 100%. |
| Drop-off by step | The share of those who reached the previous step but did not move on to the next one. |
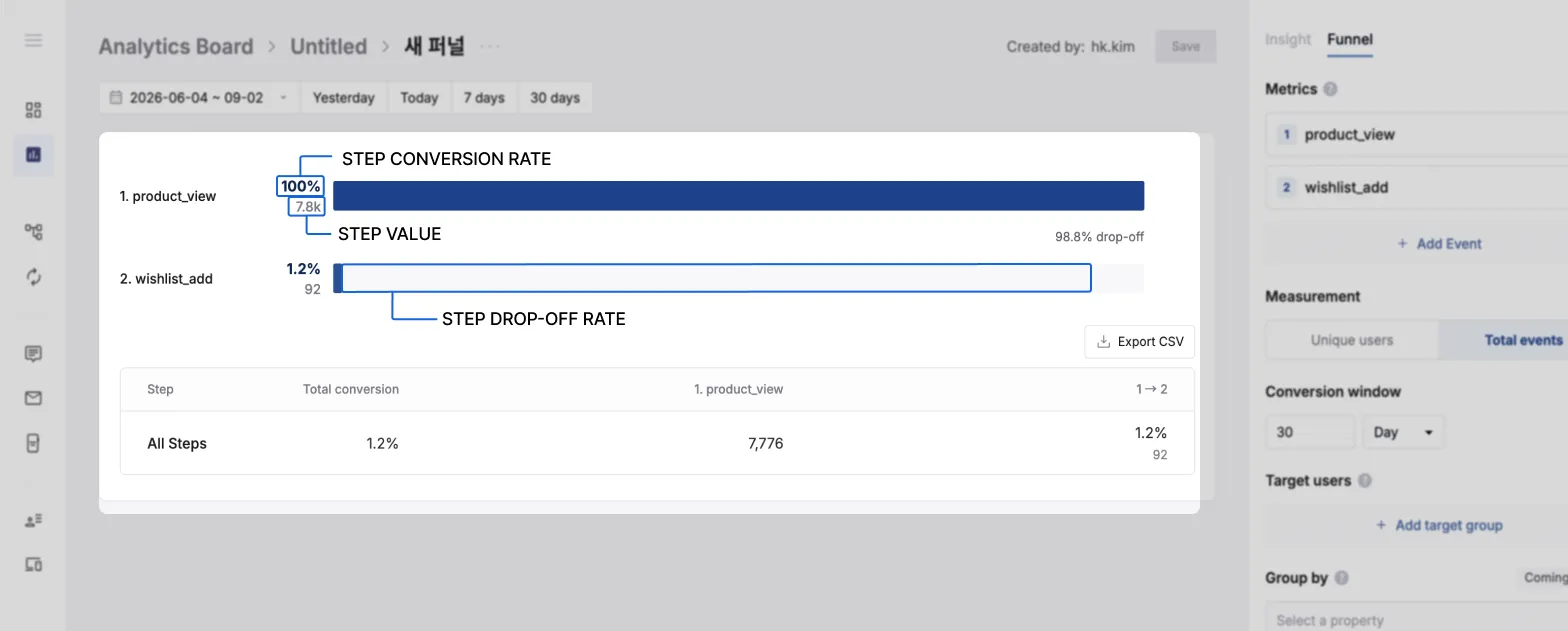
| Item | Description |
|---|---|
| Overall Conversion | The share that completed every step from step 1 to the last. |
| Conversion by step | As in the graph, the share of those who completed the previous step and reached the current one. |
| CSV download | Results shown in the table can be downloaded with Export to CSV. |