Date Range & Granularity
Date range
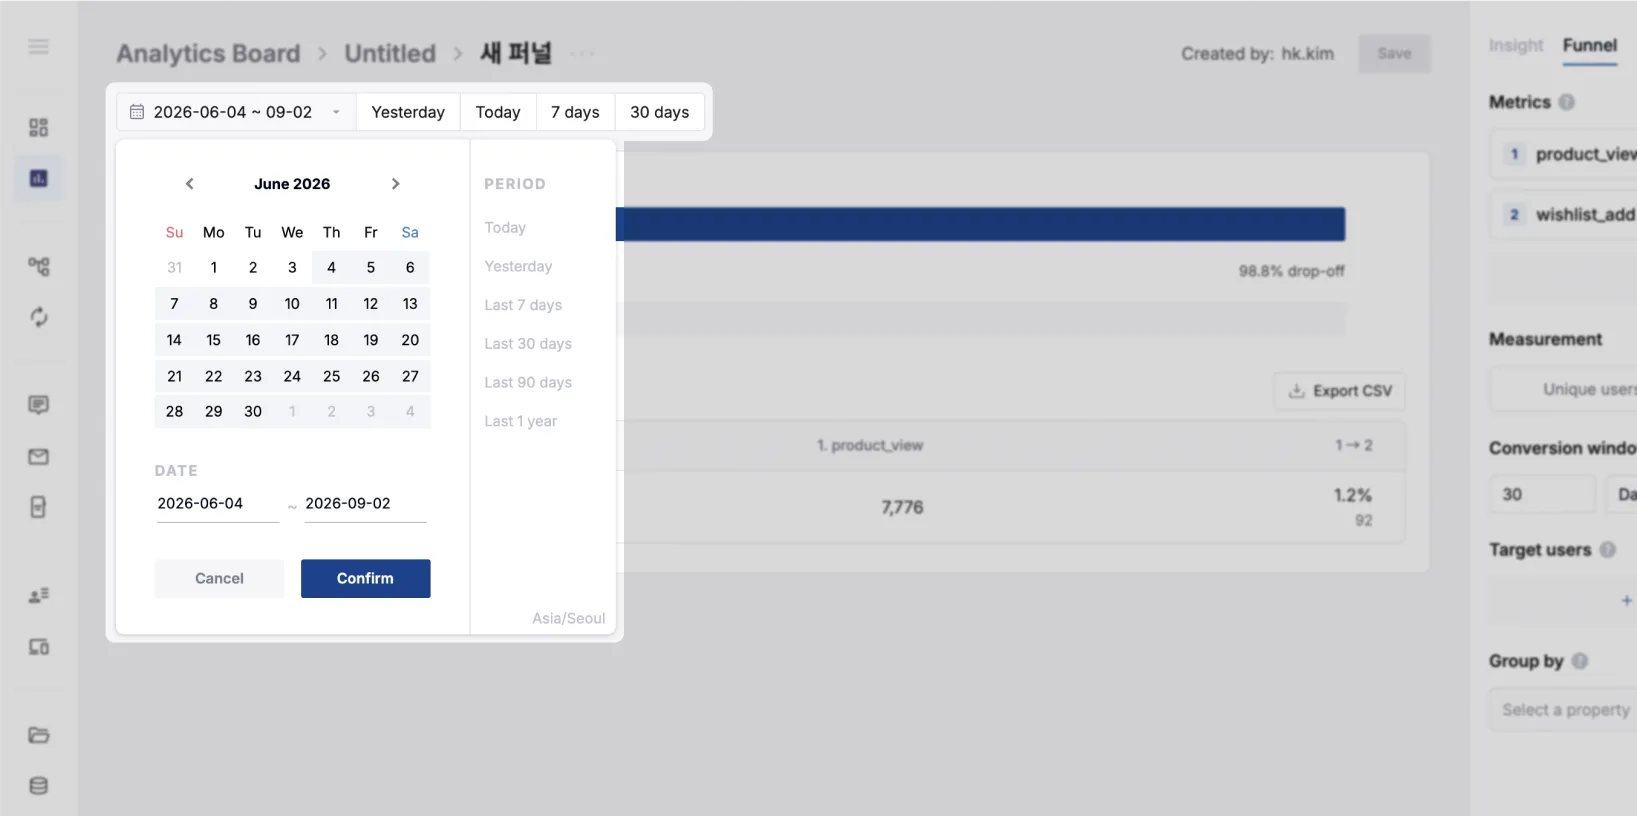
Section titled “Date range”Sets the period shown in the graph and table.
- After creating a report, select the date range from the UI at the top.
- The period shown on the graph’s X axis changes with your selection.
- All dates and times are shown in the timezone set in the console.
Time unit
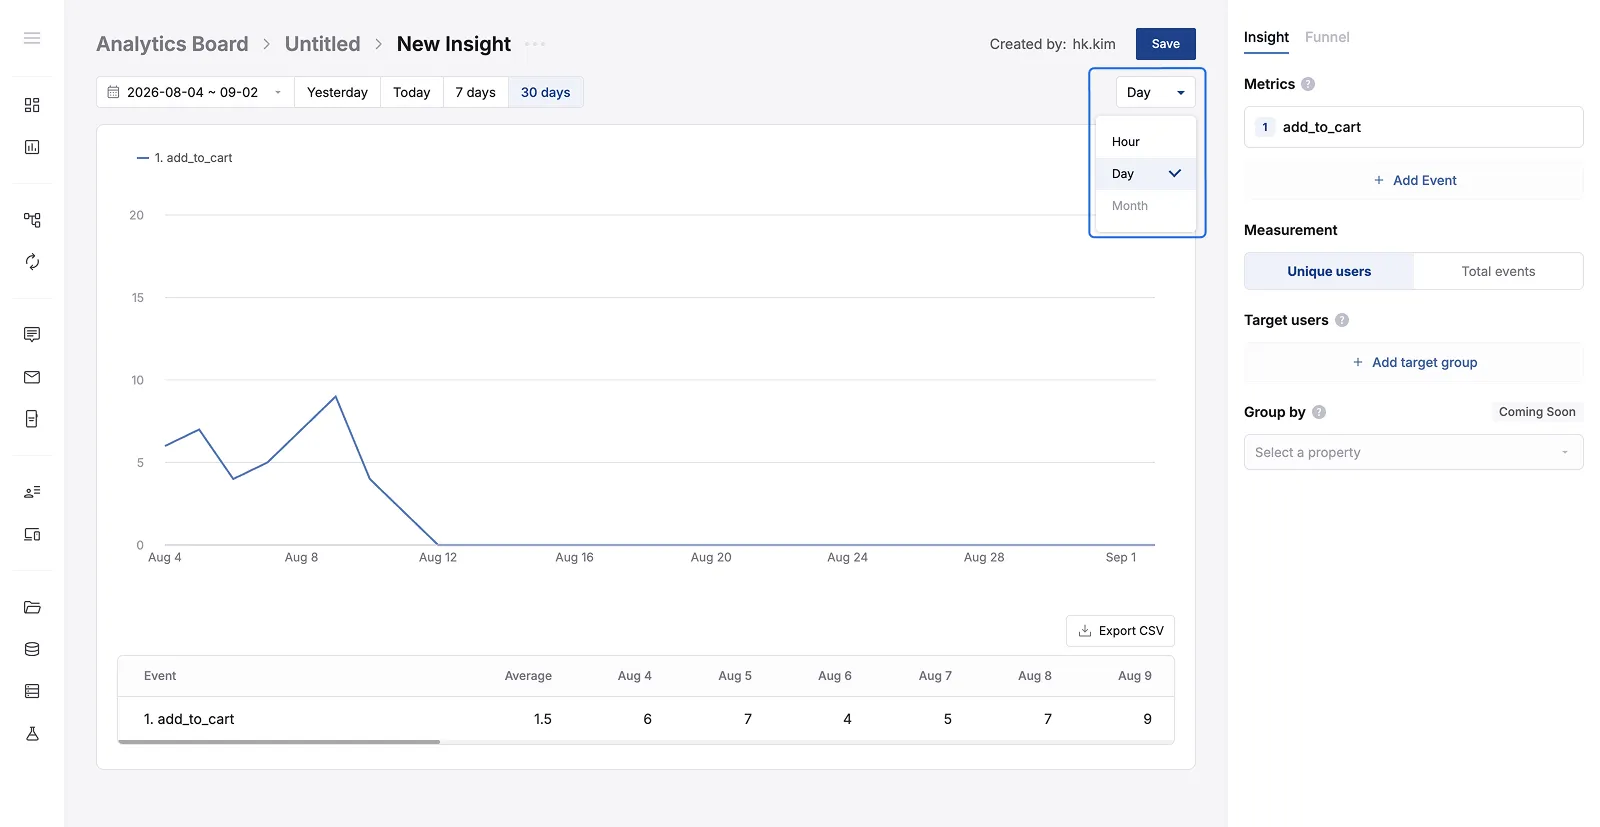
Section titled “Time unit”- The time unit chooses whether data is grouped by hour, day, or month.
- With the same 30 days of data,
Dayshows the day-by-day flow andMonthshows the month-by-month flow.
Good to know
Section titled “Good to know”- Funnels have no time unit. A Funnel aggregates the whole period as one.
- Widening the period makes the query take longer. With a lot of data it can take up to 10 minutes.
- CRM events have no data recorded before May 1, 2026. Insights therefore show 0 for that period, and Funnels may show a lower conversion rate.
- Thanks to an improved data structure, events from every device a user owns can be collected from August 1, 2026 onward.
- Before that, only events from the user’s most recently accessed device were collected.